
Home Prices Continue to Rise; May by 0.8 Percent
Oxford, Miss. (July 21, 2011) – FNC announced Thursday that U.S. home prices continued to show notable upward trends in May, extending April gains for two consecutive months of positive price momentum. Despite record foreclosure activity and rising unemployment rates in recent months, the single-family housing market continues to show signs of price stabilization in line with rising activities in new housing starts and building permits.
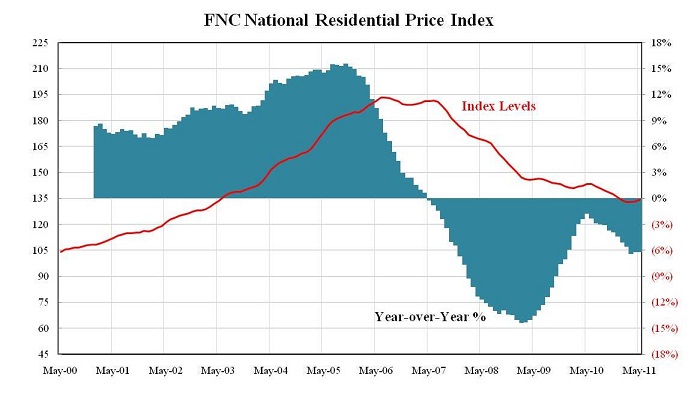
Based on the latest data on non-distressed home sales (existing and new homes), FNC’s Residential Price Index™ [1] (RPI) indicates that single-family home prices were up again in May at a seasonally unadjusted rate of 0.8%. FNC’s RPI is the industry’s first hedonic price index built on a comprehensive database blending public records with real-time appraisals of property and neighborhood attributes.[2]
As a gauge of underlying home value, the RPI excludes sales of foreclosure homes – often sold with large price discounts due to poor property conditions, such as neglected maintenance, theft, vandalism, and abandonment. Because of these and other hidden costs and risk associated with buying foreclosed properties, the resulting price discounts on foreclosure sales are not true indications of a fundamental adjustment in underlying home value. In fact, the latest gains captured by the RPI occurred despite continued pressure from higher volumes of foreclosure sales and their steep price discounts. In May, the median foreclosure price discount was up nearly 1% from April to 24.4%, and foreclosure sales (inclusive of short sales and REOs) accounted for close to 38% of total sales.[3]
All three RPI composites (the National, 30-MSA, and 10-MSA indices) continued to extend the gains from the previous month, with the National composite exhibiting the strongest one-month gain in May. On a year-over-year basis, home prices nationwide are 6.2% below the levels attained a year ago.
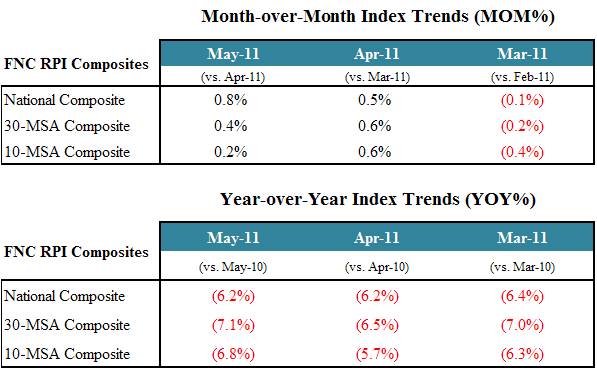
Notably, the deteriorations in the indices’ year-over-year trends in May seem to suggest price weakening since April, contrary to what month-over-month trends have indicated. These seemingly inconsistent patterns can be explained by temporary bumps in home prices surrounding the expiration of federal tax credit a year ago. In particular, the largest price rebound under the program occurred in May 2010 causing significantly inflated prices for the base month, which inevitably led to lower year-over-year price changes in May. If used alone, the latest year-over-year trends can be misleading.
Within the 30-MSA composite, home prices rose month-over-month in 18 markets by an average rate of 2.3%. Of the remaining 12 markets, the month-over-month declines were much weaker, averaging 1.3%. In a sign that conditions are stabilizing across many of the nation’s top markets, there has been a steady increase in the number of markets exhibiting positive month-over-month price momentum, up from 14 in March to 16 in April and 18 in May.
Minneapolis, Boston, Charlotte, Portland, Chicago, and Washington D.C. show the strongest price momentum – rising month-over-month since March at a cumulative total of 9.2%, 7.1%, 5.7%, 5.5%, 5.3% and 3.5% respectively. Orlando and Phoenix, on the other hand, lead the nation in home price declines during 2011–having lost close to 5.0% over the last five months, followed by Las Vegas, New York, and Miami at about 3.0%. In addition, Orlando and Phoenix top the nation in year-over-year price declines, down from a year ago by 16.4% and 15.9% respectively. The only city experiencing persistent year-over-year growth since the start of 2011 is Detroit, where home prices are up 6.8% from a year ago.
Meanwhile, consistent with stabilizing home price trends are significantly improved market liquidity in recent months. Listing activities continue to show a strong uptrend, surging more than 26% from May to June following a robust 6.9% increase in the previous month. And in a strong indication that the market is becoming increasingly more favorable to sellers, the amount of price concessions offered by homeowners is dropping steadily in size. The median listing price discount – the percentage difference between the final selling price and the owner’s asking price – is down from 7.5% in Q3 2010 and 6.6% in Q4 2010 to 4.4% in Q1 2011 and 2.2% in Q2 2011. The amount of time listed properties spend on the market is steadily falling as well, down from a median value of 5.2 months in Q4 2010 to 4.0 months in Q1 2011 and 3.0 months in Q2 2011.
[1] The FNC National Residential Price Index is a volume-weighted aggregate price index consisting of 100 major metropolitan areas across different regions of the U.S. All FNC Residential Price Indices are constructed to capture unsmoothed home price trends in the underlying housing market that excludes foreclosed properties.
[2] Detailed, real-time appraisal data is used to measure property and neighborhood attributes used in the hedonic model to control for their impact on home prices. No appraisal value is used in the index estimation, however.
[3] The foreclosure price discount is the difference between a foreclosed property’s actual sale price and its estimated market value that a buyer would be willing to pay had the property not been foreclosed upon.
Contact:
Bill Dabney
Manager, FNC Corporate Communications
1214 Office Park Drive
Oxford, MS 38655
P: (662) 236-8304 F: (662) 236-2037 C: (662) 801-7489
Tags:

