SAS® Visual Analytics’ path analysis, expanded Hadoop support and high-speed data loading help organizations see better results

Physician’s Pharmacy Alliance uses SAS data visualization and reporting software to keep high-risk patients healthy
LAS VEGAS, THE PREMIER BUSINESS LEADERSHIP SERIES (Oct. 22, 2014) – Controlling customer churn. Understanding marketplace sentiment. Pulling detailed graphical reports while traveling. Setting and meeting aggressive organizational goals. These challenges and more are met with enhancements to SAS® Visual Analytics.
“With SAS Visual Analytics, organizations can seamlessly manipulate, analyze and view data of any size, helping them transform it into stronger customer relationships, increased sales and efficiency, even healthier patients,” said Jim Davis, SAS Executive Vice President and Chief Marketing Officer. “Enhancements in the new version of SAS Visual Analytics, based on user feedback, include expanded data sources; exploration and visualization techniques; and mobile, reporting, and management capabilities.”
What’s new?
Available now, the latest SAS Visual Analytics includes:
- Goal seeking, considered the next step in forecasting. Users define a goal for a variable, such as unit sales or profitability. SAS Visual Analytics adjusts other variables, such as advertising spending or material cost, to graphically show what needs to occur to achieve that goal.
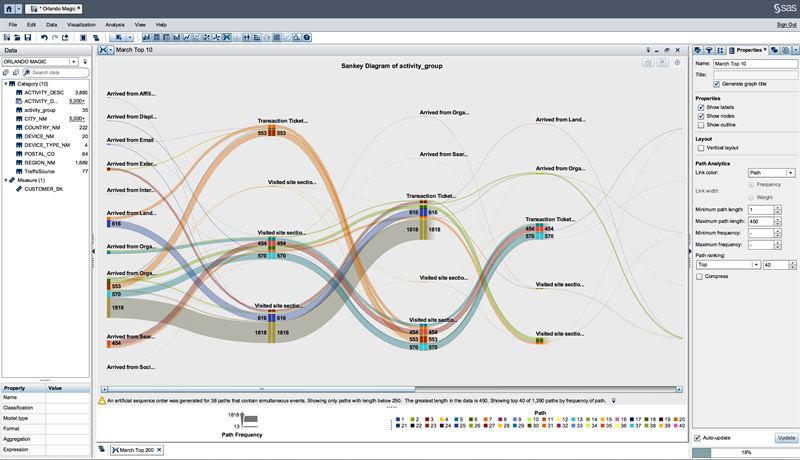
- Path analysis, an analytical means to explain how a business transaction moves through a system, graphically illustrated in SAS by a Sankey diagram. This makes it easy to identify the main paths transactions follow and spot areas that need addressing to achieve the desired result. For example, an online retailer might look at how customers move through its site – where they enter, navigate within the site, and leave. Over time, this flow information can pinpoint areas within the website that could better trigger desired customer actions.
- Deeper sentiment analysis, extending the perception of what is being said in the marketplace. SAS moves beyond counting the frequency of terms in unstructured data from warranty cards, comments and call center notes. SAS Visual Analytics can represent sentiment based on an entire document, defined terms or topics, which is virtually impossible to do manually, especially when analyzing big data.
- High-speed loading from SAP HANA into SAS Visual Analytics’ in-memory analytic engine. A significant productivity boost for SAS customers also using HANA for operational applications, this allows analytics to run more quickly and frequently on the most current data. More frequent analysis provides more precise results, and isolates micro-trends that can be acted on quickly.
- Mobile BI apps for sharing reports created in SAS Visual Analytics. Apps now support new operating systems and increase report interactivity for both iOS and Android devices.
- Expanded Hadoop support. SAS Visual Analytics now supports Cloudera Impala and Pivotal HD distributions of the Hadoop open source big data infrastructure.
Since its 2012 unveiling, organizations large and small worldwide have recognized the power of data exploration and visualization. More than 2,600 sites have licensed SAS Visual Analytics, and this growth continues.
Craig Willis, Director of Analytics at Physicians Pharmacy Alliance (PPA), explained how SAS Visual Analytics helped the medication care management firm identify high-risk patients for a service designed to keep them healthy and out of the hospital. The company works with medical programs to control costs for the chronically ill, who account for up to 85 percent of all medical spending.
“SAS Visual Analytics highlighted a correlation between the length of time required to onboard the patient and how long the patient stayed with our service,” Willis said. “It turns out that if it takes longer than 15 days to get patients enrolled, they are more likely to leave. Since those on our service have better health outcomes, we’ve streamlined our processes.”
Willis credits SAS Visual Analytics as a key contributor to saving $150,000 annually on staffing and, more importantly, improving health of the chronically ill.
In addition to PPA, other organizations that have found insight and value in SAS Visual Analytics include: Euramax Coated Products, Followmont Transport, Gitanjali Group, Local Government Federal Credit Union, SM Marketing Convergence, Taipei Medical University, Telecom Italia and many others.
To learn more about how SAS Visual Analytics can help business and IT users move to self-service business analytics, please read “A new breed of BI.”
Today’s announcement came at The Premier Business Leadership Series event in Las Vegas, a business conference presented by SAS that brings together more than 700 attendees from the public and private sectors to share ideas on critical business issues.
Steve Polilli
Steve.Polilli@sas.com
919-531-2979
About SAS
SAS is the leader in business analytics software and services, and the largest independent vendor in the business intelligence market. Through innovative solutions, SAS helps customers at more than 70,000 sites improve performance and deliver value by making better decisions faster. Since 1976 SAS has been giving customers around the world THE POWER TO KNOW®.
SAS and all other SAS Institute Inc. product or service names are registered trademarks or trademarks of SAS Institute Inc. in the USA and other countries. ® indicates USA registration. Other brand and product names are trademarks of their respective companies. Copyright © 2014 SAS Institute Inc. All rights reserved.
Tags:


