SAS® Visual Analytics and SAS® Visual Statistics integrate to help business users and data scientists work in tandem
Tighter integration helps merge self-service data exploration and reporting with advanced analytics
SAS GLOBAL FORUM - New releases from SAS ease the way for business users and data scientists to collaborate. New integration unites SAS’ popular visual data exploration software, SAS Visual Analytics, with SAS Visual Statistics, a point-and-click application for developing predictive models interactively. The updates become generally available in May,
Customers are shifting toward merging self-service data exploration and reporting with advanced analytics. Serving a wider group of users – statisticians, data scientists, line of business analysts, risk managers and others – the SAS offering makes any enterprise more nimble.
SAS Visual Statistics adds even deeper statistical analysis to existing SAS Visual Analytics capabilities. Accessed through SAS Visual Analytics’ web-based, intuitive interface, the advanced tools solve difficult problems faster for better business decisions. Data scientists can still use SAS Visual Analytics to visualize and disseminate information across an enterprise.
Both products use SAS In-Memory Analytics processing to dramatically shorten time to business insight, regardless of data size. Multiple users can concurrently analyze complex data on Hadoop clusters, relational database systems or SAS servers.
“The new releases reflect the converging needs of business professionals and data scientists, as both sets of users seek to boost their productivity,” said Wayne Thompson, SAS Chief Data Scientist. “Some business analysts want to go beyond descriptive analytics and do more with predictive analytics. SAS provides an easy way to look into the future.”
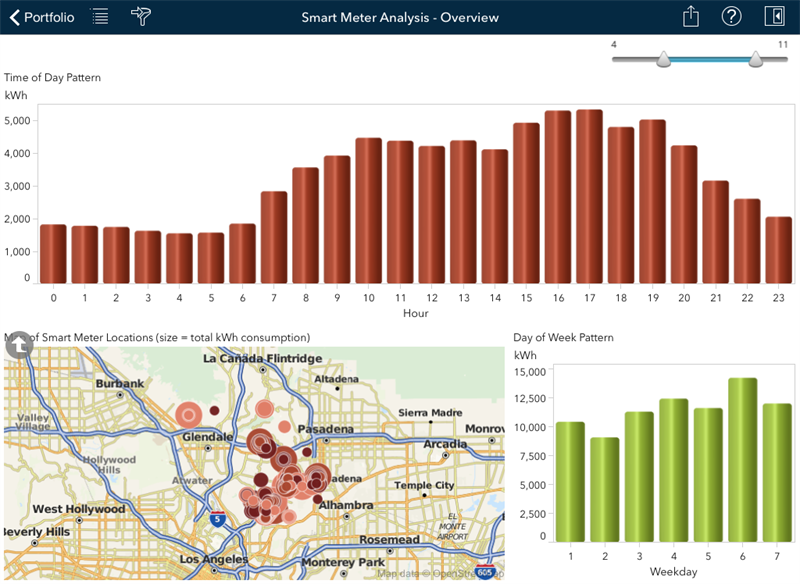
For example, users can build a regression model and then superimpose the predictions onto a geographic map with a few clicks. Data scientists can create models in SAS Visual Statistics and explore the predicted outputs in a variety of visualizations in SAS Visual Analytics, including predictive visualizations. And with support for iPhone®5 and later, and several Android smartphones, users can share and explore interactive visualizations wherever they are.
QVC visualizes customer desires
For its Italian operation, multimedia retailer QVC selected SAS visual solutions to explore and analyze business-critical data, and then distribute dynamic internal reports. SAS helps QVC:
- Explore data in a self-service manner, even by non-IT experts.
- Optimize business processes through visualizations.
- Analyze, predict, identify and accommodate future trends.
"Combining SAS Visual Statistics and SAS Visual Analytics allows us to quickly analyze and interpret customer data and supply chain performance,” said Giovanni Monopoli, Strategic Analysis and Financial Planning Manager at QVC Italy. “Today, we can easily and precisely apply advanced analytics to predict the tastes and preferences of our customers. And importantly, we can then send information to the sales force, even on a mobile device.”
Using SAS, QVC has drastically reduced time spent on reporting, and maximized interdepartmental alignment. Reports are simple and current. Data is easy to understand through custom visualizations. Users can spot otherwise hidden insights. And SAS software suggests possible actions. QVC reports that the software deployment resulted in an immediate and positive impact on decision making.
The interactive elements in SAS Visual Analytics now extend to Excel, PowerPoint and Microsoft Office products, enabling better storytelling with data. Any changes in a report are updated in the Office application.
Today's announcement was made at SAS Global Forum, the world's largest gathering of SAS users, attended by more than 5,000 business and IT users of SAS software and solutions.
For other perspectives on how analytics can produce better business insights, please visit the SAS Insights web page.
Steve Polilli
Steve.Polilli@sas.com
919-531-2979
About SAS
SAS is the leader in business analytics software and services, and the largest independent vendor in the business intelligence market. Through innovative solutions, SAS helps customers at more than 75,000 sites improve performance and deliver value by making better decisions faster. Since 1976 SAS has been giving customers around the world THE POWER TO KNOW®.
SAS and all other SAS Institute Inc. product or service names are registered trademarks or trademarks of SAS Institute Inc. in the USA and other countries. ® indicates USA registration. Other brand and product names are trademarks of their respective companies. Copyright © 2015 SAS Institute Inc. All rights reserved.
Tags:

